Wednesday, March 12, 2014

Business Research Methods (Module 5,6), IIM., Shillong)

 Lecture notes on Business Research Method  (Module 5,6),  IIM., Shillong)
D. Dutta Roy
Indian Statistical Institute
Kolkata - 700108


Module 5: Multivariate Data Analysis (6 Classes)
Coavariance, Correlation, Factor Analysis, Cluster Analysis, Discriminant Analysis, Multiple Regression, Limited Dependent Variable, Longitudinal data analysis

·         Module 6: Report Writing (1 Class)
Types of report- Research report-Harvard system of referencing-bibliography, footnote

Multivariate Techniques

Q 1: What is multivariate analysis?
Ans.: Multivariate analytical techniques are being widely applied in solving different industrial problems. It is also used by the business people in market research. Modern business data are complex and volatile. Therefore, multivariate techniques are helpful for the business related decision making. Multivariate analysis refers to all statistical methods that simultaneously analyze multiple measurements on each individual/object under investigation. Any simultaneous analysis of more than two variables can be loosely considered as multivariate analysis. Multivariate techniques are extensions of uni-variate analysis (analysis of single variable distribution) and bivariate analysis (cross classification, correlation, analysis of variance and simple regression used to analyze two variables).

Q 2: What is variate?
Ans.: Variate is the building block of multivariate analysis. Variate is a linear combination of variables with empirically determined weights. Weights are determined empirically by the multivariate techniques to meet a specific objective. The variables are specified by the researchers while the weights are determined by the multivariate technique to meet a specific objective. A variate of n weighted variables (X1 to Xn) can be stated mathematically as:
Variate value = W1X1 + W2X2 + W3X3 +…WnXn
Where, Xn is the observed variable and Wn is the weight determined by the multivariate technique. The result is a single value representing a combination of the entire set of variables that best achieves the objective of the specific multivariate analysis.

Q 3: What are the different types of multivariate techniques?
Ans.: Multivariate analysis is an ever-expanding set of techniques for data analysis. Among the more established techniques are-

i.                    Factor Analysis
ii.                  Multiple Regression Analysis and Multiple Correlation
iii.                Multiple Discriminant Analysis
iv.                Multiple Analysis of Variance and Covariance
v.                  Cluster Analysis
vi.                Longitudinal Data Analysis

Q 4: What is Factor Analysis?
Ans.: Factor Analysis is a statistical approach that is used to analyze inter-relationships among a large number of variables and to explain these variables in terms of their common underlying dimensions (factors). The objective is to find a way of condensing the information contained in a number of original variables into a smaller set of variates (factors) with a minimum loss of information.
SPSS format: Analyze>Data reduction>Factor analysis
Select variables
Extraction>Principal component analysis
Tick sign on Correlation matrix (provided data are metric in nature and correlated)
Tick sign on unrotated factor solution
Tick sign on scree plot
Tick sign on Extract eigenvalues over 1
>continue>Factor analysis rotation>Method
select varimax provided independent factors are needed
display rotated solution, loading factors
Continue
Factor analysis options :sorted by size
ok.

Syntax:
       GET
  FILE='C:\Users\ddroy\Downloads\Final_Dataset_BRM_Multivariate.sav'.
DATASET NAME DataSet1 WINDOW=FRONT.
FACTOR
  /VARIABLES SelfAwakening Emotionalcontrol Systematic SelfInsulatingLess Fearless Cleanliness NoWorkFamilyConflict NiskamPrinciple
   Challenging SelfUnderstanding Doubtless Freefromfearoffailure Resolute Active
  /MISSING LISTWISE
  /ANALYSIS SelfAwakening Emotionalcontrol Systematic SelfInsulatingLess Fearless Cleanliness NoWorkFamilyConflict NiskamPrinciple C
   hallenging SelfUnderstanding Doubtless Freefromfearoffailure Resolute Active
  /PRINT INITIAL EXTRACTION ROTATION
  /FORMAT SORT
  /PLOT ROTATION
  /CRITERIA MINEIGEN(1) ITERATE(25)
  /EXTRACTION PC
  /CRITERIA ITERATE(25)
  /ROTATION VARIMAX
  /METHOD=CORRELATION.  


Q 5: What is multiple regression analysis?
Ans.: Multiple regression analysis is the appropriate method of analysis when the research problem involves a single metric dependent variable presumed to be related to two or more metric independent variables. The objective of multiple regression analysis is to predict the changes in the dependent variable in response to changes in the independent variable. This objective is most often achieved through the statistical rule of least squares. It is used to predict the amount of magnitude of the dependent variable. For example, business researcher can predict amount of change in company’s sale from information on its expenditure for advertising, the number of sales people and the number of stores carrying its products.


Q 6: What is Multiple Discriminant Analysis?
Ans.: It is the multivariate technique to understand group differences and to predict the likelihood that an entity will belong to a particular class or group based on several metric independent variables. For example, discriminant analysis might be used to distinguish successful entrepreneurs from non-successful ones according to their demographic and psychographic profiles.

Q 7: What is Multivariate Analysis of Variance?
Ans.: Multivariate Analysis of Variance is a statistical technique that can be used to simultaneously explore the relationship between several categorical independent variables and two or more metric dependent variables. It represents an extension of univariate analysis of variance.

Q 8: What is Multivariate Analysis of Covariance?
Ans.: Multivariate Analysis of Covariance is a multivariate statistical technique to remove the effect of any uncontrolled metric independent variables on the dependent variables. It is similar to bi-variate partial correlation in which the effect of a third variable is removed from the correlation.

Q 9: What is Cluster Analysis?
Ans.: Cluster analysis is an analytical technique for developing meaningful subgroups of individuals or objects. Here the objective is to classify a sample of entities (individuals or objects) into a small number of mutually exclusive groups based on the similarities among the entities.
         Cluster analysis involves three steps. The first is the measurement of form of similarity or association among the entities to determine how many groups really exist in the sample. The second step is the actual clustering process whereby entities are partitioned into groups (clusters). The final step is to profile the persons or variables to determine their composition.

Q 10: What are the steps of examining data in multivariate data analysis?
Ans.:
Step I: Examining the shape of the distribution: The stem and leaf diagram provides a general shape of the distribution as well as it provides actual data value.
Step II: Examining the relationship between two or more variables: Researcher can use scatter plot matrix of metric variables to explore the relationship among the variables. Scatterplot matrix represents relations of all the variables, the correlation coefficients as well as the histogram of variables. 
Step III: Examining the outlier: Most of the multivariate statistics are robust in nature. So they are sensitive to change.
Step IV: Analysis of the missing data: There are some strategies to deal with missing data.
  1. Deletion of the data of the complete case.
  2. Researcher determines the extent of missing data on each case and variables, and then deletes the case or variables.
  3. Replacement of the missing data with estimated values based on other information available in the sample. For example, mean substitution, regression imputation etc.
Step V: Assessing homoscedasticity: Homoscedasticity is an assumption related primarily to dependence relationships between variables. It refers to the assumption that dependent variables exhibit equal level of variance across the range of predictor variables. The concept of homoscedasticity is based on the spread of dependent variable variance across the range of predictor variables. The most common statistical test is the Levene’s test to assess whether the variances of a single metric variable are equal across any number of groups. In case of heteroscedasticity (inequality of variances) an easy solution is data transformation.
Step VI: Examining the linearity: Almost all multivariate techniques are based upon correlational measures of association including multiple regression, factor analysis etc. Therefore correlation and association among the variables are important.
Step VII: Incorporating non-metric data with dummy variables: Researcher can use dichotomous variables known as dummy variables which act as replacement variables. A dummy variable is a dichotomous variable that represents one category of a non-metric independent variable. For example, gender has two categories, female and male. Therefore two new dummy variables are to be created. X1 would represent those individuals who are female with a value of 1 and would give all males a value of 0. Likewise X2 would represent all males with a value of 1 and give females a value of 0.

ASSIGNMENTS TO STUDENTS OF SEVEN GROUPS FOR BOTH SESSION 1 AND SESSION 2.

  • 1)      Factor analysis of SET 1 and SET 2.
  • 2)      MANOVA  for Male and Female respondents in Set 1 and Set 2.
  • 3)      Comparison of factor score of male and female in set 1 and set 2.
  • 4)      Multiple Regression to predict the total score of set 1, and set 2 by the respective values.
  • 5)      Multiple discriminant analysis to predict male and female respondents based on respective set of values in set 1 and set 2.
  • 6)      Hierarchical cluster analysis of set 1 and set 2 values.
  • 7)      Cronbach's alpha for set of values in set 1 and set 2. Is alpha values for both male and female different ?
Ans. to 1: There are 5 factors in Set 1 and 6 accounting for 53.47 and 61.5 total variances. 

Ans. to 2: 

Ans. to 3: No significant mean differences between male and female in 6 extracted factors of set 2. 

Ans. to 5: For set 1, 74.8% and for set 2, 69.6% are correct classifications to predict differences in genders through linear combination of values in their respective sets. Structured coefficient reveals for set 1, male (n=92) and female (n=59) differ in challenging, cleanliness and self-understanding. Female possessed high coefficients in cleanliness. For set 2, only pleasure differs by gender. Male has high structured coefficient. 

Friday, March 7, 2014

Bussiness Research Methods (Module 4) for IIM., Shillong

Lecture notes on Business Research Method (Module - 4)
D. Dutta Roy, ISI., Kolkata
For the PG students and fellows of Management
Indian Institute of Management
Shillong


Module-4: Data Analysis-Descriptive (3 Classes)
Data preparation, Data cleaning and missing data; Exploratory data analysis-frequency tables, bar, charts, histograms; Hypothesis testing-Logic to test-types of test-one-sample test, two sample test, Mann-Whitney U test, Kruskal-Wallis test, k-independent sample test


1. WHAT IS BUSINESS RESEARCH METHOD ?

A business research method is a careful and diligent study of a market, an industry or a particular company's business operations, using investigative techniques to discover facts, examine theories or develop an action plan based on discovered facts. It is the systematic and repeated searching process to characterize the operational process of business, its antecedent and consequence.
Here characterization means exploring properties and their relations with specific business operations. So it is objective, time bound and goal directed so that the findings can be used for action research.

http://www.slideshare.net/ddroy/workers-education

2. WHY IS IT IMPORTANT TO KNOW ?
Modern business operation follows open system where in feedback is necessary. Feedback from different task agents change operation of the business. 

3. WHAT ARE THE TYPES OF BUSINESS RESEARCH METHODS ?
Basic business research methods are :
3.1 Operation Research: A study of a firm's operational systems identifies each production step. In operations research, problems are broken down into basic components and then solved in defined steps by mathematical analysis.This type of business research helps a firm to "reduce waste, inefficiency and poor performance by examining procedures on a step-by-step basis.

3.2 Focus group: Focus groups typically consist of a small group of people consistent with a target market profile that deals with a product or service. Focus groups offer a kind of middle ground between other research methods.
3.3 Case study: This method allows for in-depth information collection, but it is typically time-intensive.
3.4 Interview: This approach typically yields deep information about one person’s experience with a product, service or company.
3.5 Survey: a survey enables researchers to gather large amounts of data quickly and at a comparatively low cost.
3.6 Analysis of secondary data: Financial data like sales, net sales, profit after tax, and many other information of the company are secondary data. Researcher will observe the data and analyze them with visual statistics.

4. WHAT IS DATA PREPARATION ?
Data Preparation involves preparation of database in the computer, data checking, data cleaning, data transformation, missing data. 

5. WHAT IS DATA CLEANING ?
It is the process of separating relevant data from irrelevant. It can be made before and after data collection.

6. HOW CAN WE CLEAN THE DATA ?
Before data collection, identify the noise and control them. After data collection, identify the extreme data or outlier using box-whisker plot.

7. HOW DO WE TREAT MISSING DATA ?
7.1  Listwise deletion
7.2  Pairwise deletion (specially for correlation)
7.3  Mean substitution
7.4  Regression substitution
__
8. WHAT IS EXPLORATORY DATA ANALYSIS ?
Exploratory data analysis (EDA) is a technique to identify systematic relations between variables when there are no (or not complete) a priori expectations as to the nature of those relations. In a typical exploratory data analysis process, many variables are taken into account and compared, using a variety of techniques in the search for systematic patterns.

9. WHAT ARE THE TECHNIQUES OF EDA ?
Some basic tools are
9.1 Analysis of single way and  multi-way frequency table or cross tabulation
9.2 Analysis of box-whisker plot
Some advanced statistical tools are
9.3 Cluster analysis
9.10 Correspondence analysis
9.11 Principal component analysis
9.14 Discriminant analysis
9.12 Multiple regression analysis

10. WHAT IS HYPOTHESIS TESTING ?
Hypothesis is prior assumption about  the results in experiment. Hypothesis testing refers to examining likelihood of the observed and expected result of experiment through statistical tools used for measuring significance like student's t, ANOVA, CHI-SQUARE, correlation etc.

11. HOW CAN WE WRITE HYPOTHESIS ?
There are two types of statistical hypothesis - null and alternative hypotheses. Null hypothesis assumes observed and expected results are same but alternative assumes difference between the two. It is the statement of probability. So use the word 'would' rather is.
Null hypothesis: There would be no significant mean differences in <variable name> between the groups.
Alternative hypothesis: There would be significant mean differences in <variable name> between the groups.

Here significance represents inference to population characteristics or parameter based on sampled data.

12. WHAT IS THE ERROR IN MAKING INFERENCE ?
Making wrong inference about the population based upon results is called error in making difference.

13. WHAT ARE THE TYPES OF ERRORS IN MAKING INFERENCE ?
There are two types of errors in making wrong inference.
Type 1 errors are made when we reject a null hypothesis by marking a difference significant, although no true difference exists.
Type 2 errors are made when we accept a null hypothesis by marking a difference not significant, when a true difference actually exists.

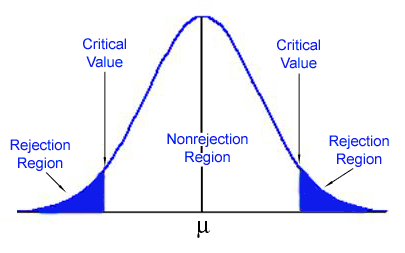
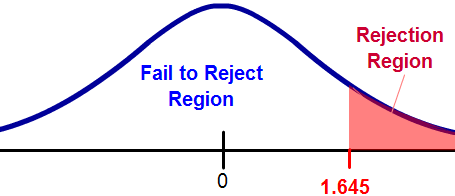
14. WHAT IS REJECTION REGION ?
 The rejection region defines the conditions under which the null hypothesis is rejected.

15. WHAT IS ONE-SAMPLE t-TEST ?
The one-sample t-test is used when we want to know whether our sample comes from a particular population but we do not have full population information available to us. For instance, we may want to know if a particular sample of college students is similar to or different from college students in general. The one-sample t-test is used only for tests of the sample mean. Thus, our hypothesis tests whether the average of our sample (M) suggests that our students come from a population with a know mean (m) or whether it comes from a different population. Formula of one sample t-test is given below:
Ref: http://lap.umd.edu/psyc200/handouts/psyc200_0810.pdf

16. WHAT IS THE DIFFERENCE BETWEEN T-TEST AND Z-TEST ?

Z-TEST / Z-STATISTIC: used to test hypotheses about  µ when the population standard deviation is known. And population distribution is normal or sample size is large

T-TEST / T-STATISTIC: used to test hypotheses about  µ when the population standard deviation is unknown.

The only difference between the z- and t-tests is that the  t-statistic estimates standard error by using the sample  standard deviation, while the z-statistic utilizes the  population standard deviation

ref: http://lap.umd.edu/psyc200/handouts/psyc200_0810.pdf

17. WHAT IS TWO SAMPLE TEST ?
Two-sample hypothesis testing is statistical analysis designed to test if there is a difference between two means from two different populations. 

15.WHAT IS THE FORMULA OF TWO SAMPLE TEST ?

Ref: http://org.elon.edu/econ/sac/twosample.htm

16. WHAT IS CHI-SQUARE TEST ?
Chi-square test represents a useful method of comparing experimentally obtained results with those to be expected theoretically on some hypothesis. Formula of chi-square test is :


where in fo = observed frequency;  fe= expected frequency

Assumptions:

  • Chi-square test follows equal probability hypothesis
  • Chi-square is not stable when any experimental frequency is less than 5. Under this condition, Yates correction is computed. 0.5 will be deducted from difference between observed and expected frequency


17. WHAT IS MANN-WHITNEY U TEST ?
The Mann-Whitney U test is used to compare differences between two independent groups when the dependent variable is either ordinal or continuous, but not normally distributed.
It can be assessed by SPSS. The Mann-Whitney test statistic "U" reflects the 
difference between the two rank totals. When dependent measure is continuous, it must be converted into rank. Here lies its difference from t-test. 
Learn more from : https://statistics.laerd.com/spss-tutorials/mann-whitney-u-test-using-spss-statistics.php

18. WHAT IS KRUSKAL WALLIS TEST ?
It is called Non-parametric ANOVA. Instead of scores, there will be ranks in each group. Kruskal-Wallis compares between the medians of two or more samples to determine if the samples have come from different populations.
At least 5 data in each group are required for comparison. 


19. WHAT IS k-independent sample test ?
k-independent sample test is the non-parametric statistics to compare more than two independent samples. It aims at determining whether the location parameters (medians) of the populations are different.
Example: In one training programs, 90 trainees were randomly assigned into three different programs like competency mapping, personality development and communication skills. After their training, they were invited to the group discussion and each one is assigned score.  The goal of analysis is to compare the median scores for the three groups and decide whether different training programs have any effect on the scores.


Sample questions
A. Here is a data set 20, 25, 30, 35,36, 37, 39, 40, 42, 50
 (a) Draw stem-leaf plot
 (b) Find out location of the mean

B. One assessor ranks 5 machines and one industrial engineer assesses machine performance. Their data are given below

Assessor's ranks : 1,2,3,4,5
Machine performance: 200, 197, 197, 196, 195

Is assessor's rank correct ?

C. Is it true or false ?
BRM  is non repetitive research.


Wednesday, February 26, 2014

Piaget's stages of Intellectual development

Piaget’s Stages of Cognitive Development

Sensory Motor Period (0 – 24 months)

Stage-Age     Characteristic Behavior
Reflexive Stage
(0-2 months)
Simple reflex activity such as grasping, sucking.
Primary Circular Reactions(2-4 months)Reflexive behaviors occur in stereotyped repetition such as opening and closing fingers repetitively.
Secondary Circular Reactions
(4-8 months)
Repetition of change actions to reproduce interesting consequences such as kicking one’s feet to more a mobile suspended over the crib.
Coordination of Secondary Reactions
(8-12 months)
Responses become coordinated into more complex sequences. Actions take on an “intentional” character such as the infant reaches behind a screen to obtain a hidden object.
Tertiary Circular Reactions
(12-18 months)
Discovery of new ways to produce the same consequence or obtain the same goal such as the infant may pull a pillow toward him in an attempt to get a toy resting on it.
Invention of New Means Through Mental Combination
(18-24 months)
Evidence of an internal representational system. Symbolizing the problem-solving sequence before actually responding. Deferred imitation.

The Preoperational Period (2-7 years)

Stage-AgeCharacteristic Behavior
Preoperational Phase
(2-4 years)
Increased use of verbal representation but speech is egocentric. The beginnings of symbolic rather than simple motor play. Transductive reasoning. Can think about something without the object being present by use of language.
Intuitive Phase
(4-7 years)
Speech becomes more social, less egocentric. The child has an intuitive grasp of logical concepts in some areas. However, there is still a tendency to focus attention on one aspect of an object while ignoring others. Concepts formed are crude and irreversible. Easy to believe in magical increase, decrease, disappearance. Reality not firm. Perceptions dominate judgment.In moral-ethical realm, the child is not able to show principles underlying best behavior. Rules of a game not develop, only uses simple do’s and don’ts imposed by authority.

Period of Concrete Operations (7-12 years)

Characteristic Behavior:
Evidence for organized, logical thought. There is the ability to perform multiple classification tasks, order objects in a logical sequence, and comprehend the principle of conservation. thinking becomes less transductive and less egocentric. The child is capable of concrete problem-solving.
Some reversibility now possible (quantities moved can be restored such as in arithmetic:
3+4 = 7 and 7-4 = 3, etc.)
Class logic-finding bases to sort unlike objects into logical groups where previously it was on superficial perceived attribute such as color. Categorical labels such as “number” or animal” now available.

Period of Formal Operations (12 years and onwards)

Characteristic Behavior:
Thought becomes more abstract, incorporating the principles of formal logic. The ability to generate abstract propositions, multiple hypotheses and their possible outcomes is evident. Thinking becomes less tied to concrete reality.
Formal logical systems can be acquired. Can handle proportions, algebraic manipulation, other purely abstract processes. If a + b = x then a = x – b. If ma/ca = IQ = 1.00 then Ma = CA.
Prepositional logic, as-if and if-then steps. Can use aids such as axioms to transcend human

Saturday, February 15, 2014

Basic Statistics


DESCRIPTIVE STATISTICS

 Statistics used to describe the pattern of data. It includes central tendency (mean, median mode), variability (Range, SD, Variance, Skewness, Kurtosis), frequency and percentage distribution.

Correlation: It is the linear relation between the variables. r is the index of correlation. It indicates strength and direction of relation. Direction is indicated by the sign advanced of r. There are few assumptions of r.

a)  The correlation coefficient r assumes that the two variables measured
form a bivariate normal distribution population.
b) Correlation does not measure nonlinear association, only linear association. The correlation coefficient is appropriate only for quantitative variables, not ordinal or categorical variables, even if their values are numerical.
c)Correlation is a measure of association, not causation
d) Scatterplot or scatter diagram: The correlation coefficient r is close to 1 if the data cluster tightly around a straight line that slopes up from left to right. The correlation coefficient is close to -1 if the data cluster tightly around a straight line that slopes down from left to right. If the data do not cluster around a straight line, the correlation coefficient r is close to zero, even if the variables have a strong nonlinear association. 
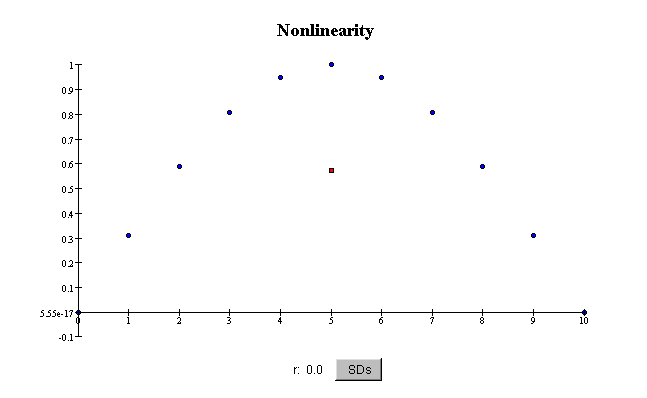
e) Some scatterplots show curved patterns. Such scatterplots are said to show nonlinear association between the two variables. The correlation coefficient does not reflect nonlinear relationships between variables, only linear ones. For example, even if the association is quite strong, if it is nonlinear, the correlation coefficient r can be small or zero.


f) The correlation coefficient r measures only linear associations: how nearly the data
falls on a straight line. It is not a good summary of the association if the scatterplot has a nonlinear
(curved) pattern.

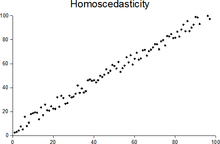
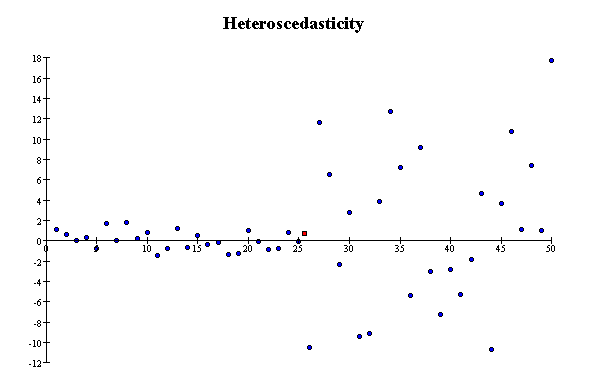
g) Scatterplots in which the scatter in Y is about the same in different vertical slices are called homoscedastic (equal scatter). Data are homoscedastic if the SD in vertical slices through the scatterplot is about the same, regardless of where you take the slice. Homoscedastic means "same scatter." In contrast, if the vertical SD varies a great deal depending on where you take the slice through the scatterplot, the data are heteroscedastic. The SD is a measure of the scatter in the list. So far, all the plots in this section have been homoscedastic. The next scatterplot shows heteroscedasticity: the scatter in vertical slices depends on where you take the slice.


h) The correlation coefficient r is not a good summary of association if the data have outliers.

REGRESSION
http://www.ncbi.nlm.nih.gov/pmc/articles/PMC374386/


History: http://www.amstat.org/publications/jse/v9n3/stanton.html


INFERENTIAL
Statistics used for testing hypotheses

Correlation


regression
rank order correlation
STATISTICAL INFERENCE
ANOVA
ANCOVA

SPSS
REPORT WRITING

BASIC CONCEPTS OF SURVEY RESEARCH

BASIC CONCEPTS OF SURVEY RESEARCH
Debdulal Dutta Roy
Indian Statistical Institute, Kolkata
Venue: Andhra University
Date: 16.2. 2014


What is Survey ?

•       It is an investigation about the characteristics of a given population by means of collecting data from a sample of that population and estimate their characteristics through the systematic use of statistical methodology or technique.

What is sample survey ?

•       A sample survey is sampling method in which a portion only and not the whole proportion is surveyed.

 Sample

•       It is a subset of a frame where elements are selected based on a randomized process with a known probability of selection.

 •       Representative sample: A representative sample is one that has all the important characteristics of the population from which it is drawn.

 What is sampling frame ?

It is a list of all members of a population used as a basis for sampling.

What is sampling ?

It is the research strategy of collecting data from a part of population with a view to drawing inferences about the whole.

Sample size

The number of sampling units which are to be included in the sample.

Sampling unit

It is one of the units into which an aggregate is divided for the purpose of sampling, each unit being regarded as individual or individuals.

Sampling fraction

The ratio of the sample size to the population size.

Probability sampling

•       In probability sampling, each population element has a known and nonzero probability of being selected. Selection probabilities arise from the use of a randomized procedure, such as random number tables.

•       It requires the existence of a sampling frame from which the sample can be drawn. Major advantage is that statistical theory can be employed to derive the properties of the sample estimators. Bias in sample selection is avoided.

Non-probability sampling

•       It is any form of sampling that fails to meet the conditions for probability sampling.

Non-probability sampling techniques

•         Haphazard, convenience or accidental sampling: The sampled elements are chosen for convenience or haphazardly, with the purpose of making inference about some general population. Examples include a sample of volunteers, street corner interviews, pull-out questionnaires in a magazine.

•         Judgment or purposive sampling or expert choice: Sampled units are selected carefully to provide a ‘ representative sample’. This is possible when expert has a good deal of information about the population element. For example, rather than relying on random choice, the individual is selected purposefully.

•         Quota sampling:  Researcher has quotas of respondents of different types to interview. For example, an interviewer may require 7 men under 55 years and 5 men 55 years or older.

Probability sampling

•        Before I can explain the various probability methods we have to define some basic terms. These are:

•        N = the number of cases in the sampling frame

•        n = the number of cases in the sample

•        NCn = the number of combinations (subsets) of n from N

•        f = n/N = the sampling fraction

•        That's it. With those terms defined we can begin to define the different probability sampling methods.

Simple Random Sampling

•        This is the simplest form of probability sampling. To select a simple random sample you need to make a numbered list of all the units in the population from which you want to draw a sample or use an already existing one (sampling frame).

•        Objective: To select n units out of N such that each NCn has an equal chance of being selected.

NCn = the number of combinations (subsets) of n from N

•        Procedure: Use a table of random numbers, a computer random number generator, or a mechanical device to select the sample.

Systematic sampling

•       Selection : In systematic sampling, sampled units are chosen at regular intervals from the sampling frame. For this method we randomly select a number to tell us where to start selecting individuals from the list.

•       Example:  a systematic sample is to be selected from 1,200 students at a school. The sample size selected is 100. The sampling fraction is 1200/100. The sampling interval is therefore 12. The number of the first student to be included in the sample is chosen randomly, for example, by blindly picking one out of 12 pieces of paper, numbered 1 to 12. If number 6 is picked, then every twelfth student will be included in the sample, starting with student number 6, until 100 students are selected. The numbers selected would be 6, 18, 30, 42, etc.

•       Advantage:  Systematic sampling is usually less time-consuming and easier to perform than simple random sampling.

•       Disadvantage: However, there is a risk of bias, as the sampling interval may coincide with a systematic variation in the sampling frame. For instance, if we want to select a random sample of days on which to count clinic attendance, systematic sampling with a sampling interval of 7 days would be inappropriate, as all study days would fall on the same day of the week, which might, for example, be a market day.

Stratified sampling

•          Assumption:  This technique requires classification of the total population into strata.  Here, sampling frame is divided into strata with assumption that strata will have significant effect on change in dependent variable.

•          Requirement:    It requires large sample. Stratified sampling is only possible when we know what proportion of the study population belongs to each group we are interested in. An advantage of stratified sampling is that it is possible to take a relatively large sample from a small group in the study population. This makes it possible to get a sample that is big enough to enable researchers to draw valid conclusions about a relatively small group without having to collect an unnecessarily large (and hence expensive) sample of the other, larger groups. However, in doing so, unequal sampling fractions are used and it is important to correct for this when generalizing our findings to the whole study population.

•          Example:  A survey is conducted on self-medication practices in a district comprising 20,000 households, of which 20% are urban and 80% rural. It is suspected that in urban areas self-medication is less common due to the vicinity of health centres. A decision is made to include 100 urban households (out of 4,000, which gives a 1 in 40 sample) and 200 rural households (out of 16,000, which gives a 1 in 80 sample). This allows for a good comparison between urban and rural self-medication practices. Because we know the sampling fraction for both strata, the rates for self-medication for all the district households can be calculated. 

Proportional Stratified Random Sampling

•         Proportional or quota random sampling, involves dividing your population into homogeneous subgroups and then taking a simple random sample in each subgroup. In more formal terms:

•         Objective: Divide the population into non-overlapping groups (i.e., strata) N1, N2, N3, ... Ni, such that N1 + N2 + N3 + ... + Ni = N. Then do a simple random sample of f = n/N in each strata.

•         Advantage:  It represent not only the overall population, but also key subgroups of the population, especially small minority groups.

•         Strata properties: Each strata must be homogenous otherwise lot of statistical precisions are required.

Cluster (Area) Random Sampling

•         Use:   when we have to sample a population that's disbursed across a wide geographic region is that you will have to cover a lot of ground geographically in order to get to each of the units you sampled.

•         Advantage:  It reduces travelling  time, money and energy of researcher.

•         Steps:

–      divide population into clusters (usually along geographic boundaries)

–      randomly sample clusters

–      measure all units within sampled clusters

 Multi-Stage Sampling

•         It is the combination of all sampling methods.

•         Example: consider the idea of sampling New York State residents for face-to-face interviews. Clearly we would want to do some type of cluster sampling as the first stage of the process. We might sample townships or census tracts throughout the state. But in cluster sampling we would then go on to measure everyone in the clusters we select. Even if we are sampling census tracts we may not be able to measure everyone who is in the census tract. So, we might set up a stratified sampling process within the clusters. In this case, we would have a two-stage sampling process with stratified samples within cluster samples. Or, consider the problem of sampling students in grade schools. We might begin with a national sample of school districts stratified by economics and educational level. Within selected districts, we might do a simple random sample of schools. Within schools, we might do a simple random sample of classes or grades. And, within classes, we might even do a simple random sample of students. In this case, we have three or four stages in the sampling process and we use both stratified and simple random sampling. By combining different sampling methods we are able to achieve a rich variety of probabilistic sampling methods that can be used in a wide range of social research contexts.

Summary

•       There are two types of sampling techniques – probabilistic and non-probabilistic.


•       Probabilistic sampling requires basic assumption of normal probability curve where as non probability sampling  does not need.