
In Marketing research one of the major problem is to classify the customers as marketing has to determine which segments offer the best opportunities. The process of dividing a market into distinct groups of buyers who have different needs, characteristics or behaviors, who might require separate products or marketing program, is called market segmentation.
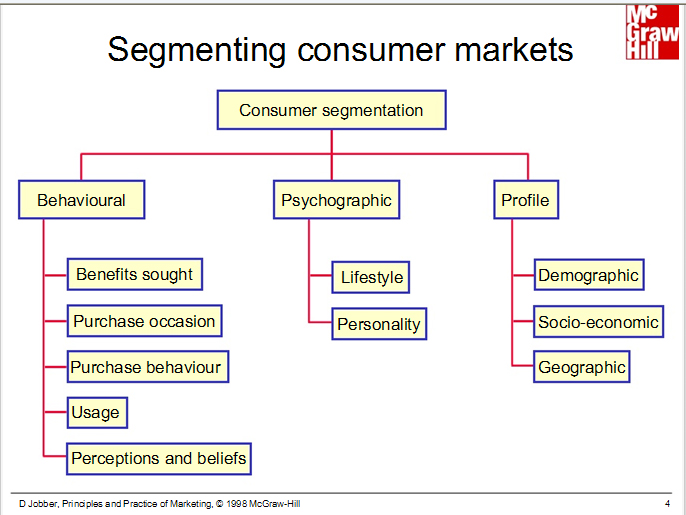
For classification, generally, demographic data are used. It is noted that some psychological factors play critical roles in changing consumer's attitude. These are intangible variables such as need profile, personality, interests, values and life styles of potential customer. For example purchasing speedy motor car depends not only on socioeconomic condition but also one's risk taking personality trait.
The idea is that marketers can sell the product to enhance the life style of the consumers. For example, by defining bathing style of customers using bar soap, marketers push liquid soap to enhance life style of the consumers. In life style analysis, marketing researcher should study all the activities of consumers - working, shopping, holiday and social life. In analysis of behaviour, followings will be taken into account as End use, Benefits sought, loyalty, usage rate etc.Alexandre Psychographic profile data can be used for brand development

Psychographic data provide market intelligence to the company. Based on psychographic segmentation, company can modify it's width or depth of business. It is the process of exploring business opportunities or to identify specific opportunities for cross sell or up sell.

LIFE STYLE
Cell phone research:
How often
- do you send text message?
- do you talk on cell phone ?
- do you use social networking site ?
- do you meet person outside your school work ?
- do you often talk on landline phone ?
- do you use e-mail?
Collection from study.com
Psychographic data are important for market segmentation so that market potential across different segmented markets can be understood. Most marketing departments use multiple segmentation strategies.
Multiple Segmentation Strategies
Geography
Demographics
Psychographics
Benefits sought
Usage rate
Geographic Segmentation
One of the first variables that the team could use in their segmentation strategy is geographic. This would allow the team to break the market into sections by climate, density, market size, world or states. Many companies use climate if their products or services rely on the weather, such as snow shovels, melting pavement salt, wave runners and boats. Our Town USA is more interested in targeting geographic locations that are located near the park in a 100-mile radius. They believe some customers will fly in from out of state, so in addition, they will target large-density areas nearby.
Demographic Segmentation
Demographic segmentation is extremely important to all marketing departments since the data is easily available and does drastically affect buying patterns. Age, income, gender, ethnic background and family life cycle are all important factors of demographic segmentation. The park is going to use an age range of 2-60 years of age so they can include kids, teens, parents and even grandparents. The income level would have to be middle to upper class - $50,000 annual income or above - since park tickets are very expensive. The amusement park is not a gender-specific product, and ethnicity will also not affect the overall plan.
The marketing team is very interested in the family life cycle sub-segments. Family life cycle segmentation is a series of stages determined by a combination of age, marital status and the number of children in a household. Obviously, the park is very interested in the family life cycle of young single, young married with kids, middle-aged married with kids, young divorced with children and middle-aged divorced with kids. They plan on advertising via social media and local cable ads where parents and kids congregate.
RESEARCH DESIGN
In this analysis, the dependent variables are
how frequently customers purchase a given item, how much they spend on the item per year, and what factors cause them to purchase the item.
Some useful links are:
http://www.ehow.com/info_8244606_psychographic-data-marketing.html
Lifestyle psychographic:http://www.warc.com/fulltext/esomar/80217.htm
Big-5: http://digitalmarketingmagazine.co.uk/digital-marketing-features/psychographic-profiling-identifying-new-levels-of-customer-understanding/787
Substance abuse : http://www.ncbi.nlm.nih.gov/pubmed/24729744