5. Basic assumptions
5.2. Prediction
5.2.1. Least square and Residuals
5.2.2 Simple and Multiple Regression
5.3 Theory of Variates
5.2.1 B coefficients
5.2.2 Beta coefficients
5.4 Discriminant function
5.4.1 Centroid
5.4.2 Wilks’ Lambda
5.4.3. Canonical Correlation
5.2 Prediction:
A statement about what you think will or might happen in the future. A prediction is what someone thinks will happen. A prediction is a forecast, but not only about the weather. Pre means “before” and “diction” has to do with talking. So a prediction is a statement about the future. It's a guess, sometimes based on facts or evidence, but not always.
5.2.1. Least square and Residuals:
The most important application is in data fitting. The best fit in the least-squaressense minimizes the sum of squared residuals. A residual is the difference between an observed value, and the fitted value provided by a model. The method of least squares can also be derived as a method of moments estimator.
5.2.2 Simple and Multiple regression
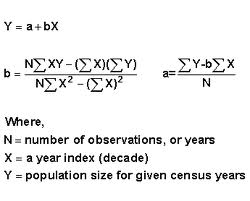
Regression generates what is called the "least-squares" regression line. The regression line takes the form:  = a + b*X, where a and b are both constants, (pronounced y-hat) is the predicted value of Y and X is a specific value of the independent variable. Such a formula could be used to generate values of for a given value of X. For example, suppose a = 10 and b = 7. If X is 10, then the formula produces a predicted value for Y of 45 (from 10 + 5*7). It turns out that with any two variables X and Y, there is one equation that produces the "best fit" linking X to Y. In other words, there exists one formula that will produce the best, or most accurate predictions for Y given X. Any other equation would not fit as well and would predict Y with more error. That equation is called the least squares regression equation.
But how do we measure best? The criterion is called the least squares criterion and it looks like this:

You can imagine a formula that produces predictions for Y from each value of X in the data. Those predictions will usually differ from the actual value of Y that is being predicted (unless the Y values lie exactly on a straight line). If you square the difference and add up these squared differences across all the predictions, you get a number called the residual or error sum or squares (or SSerror). The formula above is simply the mathematical representation of SSerror. Regression generates a formula such that SSerror is as small as it can possibly be. Minimising this number (by using calculus) minimises the average error in prediction.
Y=a+bX-e
Multiple regression is an extension of simple linearregression. It is used when we want to predict the value of a variable based on the value of two or more other variables. The variable we want to predict is called the dependent variable (or sometimes, the outcome, target or criterion variable).
Multiple regression analysis is a powerful technique used for predicting the unknown value of a variable from the known value of two or more variables- also called the predictors.
Confidence interval
http://faculty.cas.usf.edu/mbrannick/regression/Prediction.html
5.3 Theory of variates
a quantity having a numerical value for each member of a group, especially one whose values occur according to a frequency distribution.It is the weight to each array variable.
5.3.1 b-coefficient
Beta coefficient :
In statistics, standardized coefficients or beta coefficients are the estimates resulting from a regression analysis that have been standardized so that the variances of dependent and independent variables are same.
Standardized coefficients refer to how many standard deviations a dependent variable will change, per standard deviation increase in the predictor variable.
For univariate regression, the absolute value of the standardized coefficient equals the correlation coefficient.
Standardization of the coefficient is usually done to answer the question of which of the independent variables have a greater effect on the dependent variable in a multiple regression analysis, when the variables are measured in different units of measurement (for example, income measured in dollars and family size measured in number of individuals).
5.4 Discriminant function
Discriminant function:
A function of several variates used to assign items into one of two or more groups.
The function for a particular set of items is obtained from measurements of the variates of items which belong to a known group.
A particular combination of continuous variable test results designed to achieve separation of groups; for example, a single number representing a combination of weighted laboratory test results designed to discriminate between clinical classes.
Example
Any algorithm or assessment tool to evaluate disease severity or guide clinical or administrative decisions in health care. In gastroenterology, e.g., a discriminant function is commonly used to gauge the severity of alcoholic hepatitis. It uses two variables, the patient's measured protime (PT) and total serum bilirubin level. The difference between the patient's PT and the control PT is multiplied by 4.6 and added to the bilirubin level. If the derived number is greater than 32, the patient may benefit from treatment with corticosteroids or pentoxifylline.
5.4.1. Centroid
The method of discriminant function analysis (DFA) introduces a new concept-- i.e., the centroid. A centroid is a value computed by finding the weighted average of intercepts for a set of regression equations. A centroid is mapped in 3 dimensional space.
In DFA as in principal components analysis and factor analysis, a constructed variance pool is created from the calculation of all possible pair wise regression coefficients, using all predictor variables. Each equation includes a y intercept, respectively. The weighted averaging of predicted Y values results in C, the centroid.
All possible pair wise calculations of correlations among predictors are completed. Standardized regression coefficients are next computed. The best weighted combination of predictors is identified and the first function is repeated.
The process of extracting weighted combinations of predictors continues until all variance shared by predictors has been extracted.
Each weighted combination of predictors describes a linear equation that defines a discrminant function.
A centroid for each function is computed at each step of the calculation.
For example, C first = a + bx1,x2 + a + bx,x + a + bx,x
Centroid 2 through Centroid 5 would be computed in the same way. C 6 would be an error function expressing residual variation.
Functions are also computed, each as a vector or set of loadings that discrminate the three learning styles. If a set of functions were computed that discrminated the 3 styles, it might look like this.
5.4.2 Willa's. Lambda
In statistics, Wilks's lambda distribution(named for Samuel S. Wilks), is a probability distribution used in multivariate hypothesis testing, especially with regard to the likelihood-ratio test and multivariate analysis of variance (MANOVA).
In discriminant analysis, Wilk’s lambda tests how well each level of independent variable contributes to the model. The scale ranges from 0 to 1, where 0 means total discrimination, and 1 means no discrimination. Each independent variable is tested by putting it into the model and then taking it out — generating a Λ statistic. The significance of the change in Λ is measured with an F-test; if the F-value is greater than the critical value, the variable is kept in the model.
5.4.3. Canonical correlation