
DESCRIPTIVE STATISTICS
Statistics used to describe the pattern of data. It includes central tendency (mean, median mode), variability (Range, SD, Variance, Skewness, Kurtosis), frequency and percentage distribution.
Correlation: It is the linear relation between the variables. r is the index of correlation. It indicates strength and direction of relation. Direction is indicated by the sign advanced of r. There are few assumptions of r.
a) The correlation coefficient r assumes that the two variables measured
form a bivariate normal distribution population.
b) Correlation does not measure nonlinear association, only linear association. The correlation coefficient is appropriate only for quantitative variables, not ordinal or categorical variables, even if their values are numerical.
c)Correlation is a measure of association, not causation
d) Scatterplot or scatter diagram: The correlation coefficient r is close to 1 if the data cluster tightly around a straight line that slopes up from left to right. The correlation coefficient is close to -1 if the data cluster tightly around a straight line that slopes down from left to right. If the data do not cluster around a straight line, the correlation coefficient r is close to zero, even if the variables have a strong nonlinear association.
e) Some scatterplots show curved patterns. Such scatterplots are said to show nonlinear association between the two variables. The correlation coefficient does not reflect nonlinear relationships between variables, only linear ones. For example, even if the association is quite strong, if it is nonlinear, the correlation coefficient r can be small or zero.
f) The correlation coefficient r measures only linear associations: how nearly the data
falls on a straight line. It is not a good summary of the association if the scatterplot has a nonlinear
(curved) pattern.
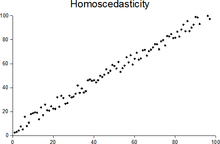
g) Scatterplots in which the scatter in Y is about the same in different vertical slices are called homoscedastic (equal scatter). Data are homoscedastic if the SD in vertical slices through the scatterplot is about the same, regardless of where you take the slice. Homoscedastic means "same scatter." In contrast, if the vertical SD varies a great deal depending on where you take the slice through the scatterplot, the data are heteroscedastic. The SD is a measure of the scatter in the list. So far, all the plots in this section have been homoscedastic. The next scatterplot shows heteroscedasticity: the scatter in vertical slices depends on where you take the slice.
h) The correlation coefficient r is not a good summary of association if the data have outliers.
REGRESSION
http://www.ncbi.nlm.nih.gov/pmc/articles/PMC374386/
History: http://www.amstat.org/publications/jse/v9n3/stanton.html
INFERENTIAL
Statistics used for testing hypotheses
Correlation
regression
rank order correlation
STATISTICAL INFERENCE
ANOVA
ANCOVA
SPSS
REPORT WRITING
No comments:
Post a Comment