
- Lecture Notes: Socio-cultural implications of Correlation Coefficients and t tests
- Debdulal Dutta Roy, Ph.D.(Psy.)
- Psychology Research Unit
- Indian Statistical Institute, Kolkata
- Venue: Seminar, Hall, Old Building, Hiralal Mazumdar Memorial College for Women, Kolkata 35
Socio-cultural change, statistics and Bhakti tatwa
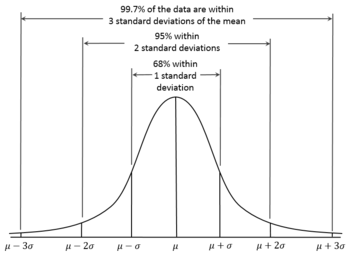
Modern society is rapidly changing with the change in the policies of the Government related to technology, liberalization, privatization and globalization. The society is changing by the change in climate, by the change in landscape and by the change in the policies of our neighbouring countries. Social change affects our values, our culture and our lifestyle. Society is open system therefore any change in any part of the system may affect change in the other part. Social change should not be forced. It should serve the needs of larger society, the population. Forced change retaliates. Forced change causes harm to society. Any Socio-cultural change has three steps - unfreezing, changing and refreezing. Hiralal Mazumdar Memorial College for Women was established in 1959 in the vicinity of Dakshineswar to educate women. Educating women causes social and cultural change. The college is close to the Dakshineswar temple where each has equal opportunity to worship the image just like normal probability curve. Once here, many revolutionary social reformers came to understand the flexibility in religion preached by Shri Ramakrishna Paramhansa who has seen the God in sage and in sinner, in righteous and in non-righteous. God has no skewed distribution (asymmetry of the probability distribution)
.svg/2000px-Negative_and_positive_skew_diagrams_(English).svg.png)
just like normal probability curve. During his period, the society was divided by religion, by caste and by Socio-Economic conditions. As statistician, he identified two different populations and also the latent relations between them. Proving the truth and establishing are not very easy as common people could not understand. So he developed new theory of social change that is mixed with bhakti bad or bhakti tatwa. The bhakti bad reduces the gap between two populations and changes the society.
To sum up, planned socio-cultural change needs statistics. Statistics provides insight about planning for social change and development. It can give us knowledge about roles of predictors, predicted, mediating, moderators and intervening variables in social change. Both correlation and t-statistics are important in designing hypothesis of social change.
Is statistics science ?
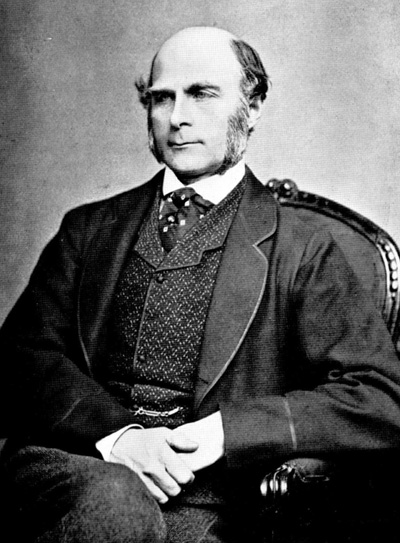
The object of statistical science is to discover methods of condensing information concerning large groups of allied facts into brief and compendious expressions suitable for discussion --Sir Francis Galton (1822-1911).
This statement includes 5 important things:
a. Statistics is science rather instrument for assessment.
b. It aims at discovering methods to condense information.
c. It is concerned with large group of allied facts.
d. It aims at condensing information into brief and compendious expression. Compendious expression means a concise explanation.
Francis Galton (1822-1911)
Sir Francis Galton, FRS (16 February 1822 – 17 January 1911) was an English Victorian statistician, progressive, polymath, sociologist, psychologist,anthropologist, eugenicist, tropical explorer, geographer, inventor, meteorologist, proto-geneticist, and psychometrician. He was knighted in 1909.
Francis Galton discovered the concept of correlation in the late fall of 1888. In 1870s, Galton was faced with a problem: how to reconcile an empirical fact with a mathematical theorem. The fact was that most physical measurements were approximately normally distributed in the population he studied. The theorem was the central limit theorem, which stated that the normal distribution should arise when an object is subjected to a large number of independent disturbances, no few of them dominant. Galton resolved this dilemma with the help of an ingenious analogue computer, the Quincunx.
In late 1888, Galton was faced three research questions that motivated him to think of correlation. One was a question in anthropology: if a single thigh bone is recovered from an ancient grave, what does its length tell the anthropologist about the total height or statire of the individual to whom it had belonged? The second was a question in forensic science: is there any relation among different parts of the same person? His another question is about relation of the heights of parents and of their siblings. After the death of Galton,
his work on correlation was published by Pearson in his journal Biometrika.
Assignment: Compute profile similarity

Contribution of Galton
Galton contributed some important thoughts of computing correlation.
a. Quasi - normal: All physical scales do not have same properties, therefore, variables that have approximately normal is called quasi-normal.
b. Statistical scale: It is the measurements in terms of the number of standard deviation units from the mean (although Galton used median deviation units from the median).

c. Cross tabulation: Association of the distribution of two sets of variables is cross tabulation. Galton gave cross tabulation of the heights of the adult child and height of the midparent (female heights were rescaled by multiplying by 1.08, and midparent heights were computed by averaging the height of the father and the rescaled height of the mother (Stigler, 1986).
d. Correlation: two variables are correlated because they share a common set of influences. He described the effect of correlation on the dispersion of differences. Low correlation indicates high dispersion of differences.
Karl Pearson was influenced by Galton's work. After the death of Galton, he wrote Galton's work in his journal Biometrika. Both Galton and Pearson didn't consider correlation as causal relations. Like Galton, Pearson treated regression as causal relations.
Francis Galton conceived correlation and Pearson formulated the product moment correlation coefficient. The formula of r is given below. Correlation is related to covariance.
Covariance and Correlation

Correlation is another way to determine how two variables are related. In addition to telling you whether variables are positively or inversely related, correlation also tells you the degree to which the variables tend to move together.


Pearson product moment correlation coefficient is very sensitive and non-robust statistics. Therefore, user must be cautious of its assumptions.
Assumptions
Interval or Ratio scale:
Linearly related:
Normally distributed:
MEASUREMENT SCALES

Homoscedasticity:
This assumption means that the variance around the regression line is the same for all values of the predictor variable (X). The plot shows a violation of this assumption. For the lower values on the X-axis, the points are all very near the regression line.
Student's t-distribution
 Karl Pearson stressed on large sample for statistical computation. His student, William Sealy Gosset, published one research paper titled " Probable error of Mean" in Pearson's journal, Biometrika on t-statistics in the pen name 'Student' in 1908. If the number of experiments be very large, we may have precise information as to the value of the mean, but if our sample be small, we have two sources of uncertainty-(i)owing to the "error of random sampling" the mean of our series of our experiments deviates more or less widely from the mean of the population and (2) the sample is not sufficiently large to determine what is the law of distribution of individuals. Gosset formulated a formal method using small samples in order to generate representative statistics.
The Student’s t-test
The Student’s t-test is a statistical test that can be used to test the null hypothesis that the difference between 2 means was caused by chance alone. By convention, if the p value is greater than 0.05 we conclude that the difference between the 2 means is NOT significant (i.e. there is a relatively high probability that it was caused by chance alone.) On the other hand, if the p value is less than 0.01 we conclude that the difference between the 2 mean is highly significant (i.e. there is a very low probability that it was caused by chance alone.) A p value between 0.01 and 0.05 is considered a borderline region, the difference is considered significant but not highly significant. In this case we would probably want to collect more data before we make a conclusion.

Research Studies
1.A Study on Self-reported Socio-Economic status by the Primary school children in rural areas: A problem of Social Survey -by Author


Ref: "A Study on Self-reported Socio-Economic status by the Primary school children in rural areas: A problem of Social Survey”. by Author
References
Stigler, S.M. (1986). The history of Statistics: The Measurement of uncertainty before 1900. Belknap Press, Cambridge, Mass.
Karl Pearson was influenced by Galton's work. After the death of Galton, he wrote Galton's work in his journal Biometrika. Both Galton and Pearson didn't consider correlation as causal relations. Like Galton, Pearson treated regression as causal relations.
https://projecteuclid.org/download/pdf_1/euclid.ss/1177012580
a. Statistics is science rather instrument for assessment.
b. It aims at discovering methods to condense information.
c. It is concerned with large group of allied facts.
d. It aims at condensing information into brief and compendious expression. Compendious expression means a concise explanation.
Francis Galton (1822-1911)
Sir Francis Galton, FRS (16 February 1822 – 17 January 1911) was an English Victorian statistician, progressive, polymath, sociologist, psychologist,anthropologist, eugenicist, tropical explorer, geographer, inventor, meteorologist, proto-geneticist, and psychometrician. He was knighted in 1909.
Francis Galton discovered the concept of correlation in the late fall of 1888. In 1870s, Galton was faced with a problem: how to reconcile an empirical fact with a mathematical theorem. The fact was that most physical measurements were approximately normally distributed in the population he studied. The theorem was the central limit theorem, which stated that the normal distribution should arise when an object is subjected to a large number of independent disturbances, no few of them dominant. Galton resolved this dilemma with the help of an ingenious analogue computer, the Quincunx.
In late 1888, Galton was faced three research questions that motivated him to think of correlation. One was a question in anthropology: if a single thigh bone is recovered from an ancient grave, what does its length tell the anthropologist about the total height or statire of the individual to whom it had belonged? The second was a question in forensic science: is there any relation among different parts of the same person? His another question is about relation of the heights of parents and of their siblings. After the death of Galton,
his work on correlation was published by Pearson in his journal Biometrika.
Assignment: Compute profile similarity

Contribution of Galton
Galton contributed some important thoughts of computing correlation.
a. Quasi - normal: All physical scales do not have same properties, therefore, variables that have approximately normal is called quasi-normal.
b. Statistical scale: It is the measurements in terms of the number of standard deviation units from the mean (although Galton used median deviation units from the median).

c. Cross tabulation: Association of the distribution of two sets of variables is cross tabulation. Galton gave cross tabulation of the heights of the adult child and height of the midparent (female heights were rescaled by multiplying by 1.08, and midparent heights were computed by averaging the height of the father and the rescaled height of the mother (Stigler, 1986).
d. Correlation: two variables are correlated because they share a common set of influences. He described the effect of correlation on the dispersion of differences. Low correlation indicates high dispersion of differences.
Karl Pearson was influenced by Galton's work. After the death of Galton, he wrote Galton's work in his journal Biometrika. Both Galton and Pearson didn't consider correlation as causal relations. Like Galton, Pearson treated regression as causal relations.
Karl Pearson (27th March, 1857- 27th April, 1936)
Karl Pearson,FRS,(27 March, 1857 – 27 April, 1936) was an influential English mathematician and biostatistician. He has been credited with establishing the discipline of mathematical statistics, and contributed significantly to the field of biometrics, meteorology, theories of social Darwinism and eugenics.Pearson was also a protégé and biographer of Sir Francis Galton. In 1911 he founded the world's first university statistics department at University College London.

When Galton died, he left the residue of his estate to the University of London for a Chair in Eugenics. Pearson was the first holder of this chair—the Galton Chair of Eugenics, later the Galton Chair of Genetics—in accordance with Galton's wishes. He formed the Department of Applied Statistics (with financial support from the Drapers' Company), into which he incorporated the Biometric and Galton laboratories. He remained with the department until his retirement in 1933, and continued to work until his death in 1936.Karl Pearson,FRS,(27 March, 1857 – 27 April, 1936) was an influential English mathematician and biostatistician. He has been credited with establishing the discipline of mathematical statistics, and contributed significantly to the field of biometrics, meteorology, theories of social Darwinism and eugenics.Pearson was also a protégé and biographer of Sir Francis Galton. In 1911 he founded the world's first university statistics department at University College London.
Francis Galton conceived correlation and Pearson formulated the product moment correlation coefficient. The formula of r is given below. Correlation is related to covariance.
Covariance and Correlation
Covariance indicates how two variables are related. A positive covariance means the variables are positively related, while a negative covariance means the variables are inversely related. The formula for calculating covariance of sample data is shown below.
x = the independent variable
y = the dependent variable
n = number of data points in the sample
 = the mean of the independent variable x
 = the mean of the dependent variable y
y = the dependent variable
n = number of data points in the sample
= the mean of the independent variable x = the mean of the dependent variable yCorrelation is another way to determine how two variables are related. In addition to telling you whether variables are positively or inversely related, correlation also tells you the degree to which the variables tend to move together.
Correlation standardizes the measure of interdependence between two variables and, consequently, tells you how closely the two variables move. The correlation measurement, called a correlation coefficient, will always take on a value between 1 and – 1:
- If the correlation coefficient is one, the variables have a perfect positive correlation. This means that if one variable moves a given amount, the second moves proportionally in the same direction. A positive correlation coefficient less than one indicates a less than perfect positive correlation, with the strength of the correlation growing as the number approaches one.
- If correlation coefficient is zero, no relationship exists between the variables. If one variable moves, you can make no predictions about the movement of the other variable; they are uncorrelated.
- If correlation coefficient is –1, the variables are perfectly negatively correlated (or inversely correlated) and move in opposition to each other. If one variable increases, the other variable decreases proportionally. A negative correlation coefficient greater than –1 indicates a less than perfect negative correlation, with the strength of the correlation growing as the number approaches –1.


Assumptions
Interval or Ratio scale:
Linearly related:
Normally distributed:
MEASUREMENT SCALES
Nominal Scale
It is a system of assigning number symbols for labeling. Researcher uses this scale for classification following three principles -minimization, equality and discrimination.
Minimization : Response categories are smaller. These are usually 2 or 3. For example, in the Eysenck Personality Questionnaire or EPQ, response categories are three - yes, no, don't know.Discrimination: Assigned numbers should make adequate discrimination between the labels. In EPQ, Items measuring psychoticism do not overlap with items measuring neuroticism. Non-overlapping enhances good discrimination power of the questionnaire. Discrimination principle asserts unequal identity or dissimilar properties in the object or event.Equality: In Nominal Scale, only rule for assigning numbers is that all members of any class shall have the same number and that no two classes shall be assigned the same numbers. This rule accepts principles of equality. Equality principle asserts that each object or event must have same identity. For example, girls with different heights have common property, i.e. they all are girls. Therefore all girl respondents are assigned ‘2’.
INSTRUCTION: Instruction of nominal scale includes how to label the response. For example, put tick mark over 1 if you are boy and over 2 if you are girl.ITEM STEM: Item stem asks for label.
Examples:
a) Are you boy or girl? Boy=1, Girl=2.
b) What is your religion? Hindu=1, Islam=2, Christian=3.
c) What is your Caste? S.T=1, S.C=2, O.B.C=3, General=4.
STATISTICS: Frequency and percentage are common descriptive statistics. Chi-square can be used for drawing inferences. Variables with nominal scale can be used as explanatory or independent variables in t-statistics. By adding frequency of similar response, score can be computed. For example, there are 20 items in the questionnaire, out of them 10 items with 'yes' response measure neuroticism. The questionnaire has been administered to patient suffering from General anxiety disorder. It is noted all the 10 items receive 'yes' response. So the score is 10. Extent of score variation indicates extent of neuroticism. Based on score, distance in traits between individuals can be possible but not between the nominal categories. Distance between Yes, No categories of two items can not be determined.
Advantages:
a) Nominal scale is useful for classification or categorization.
b) It is more flexible. According to hypothesis, numerical values can be assigned.
c) Nominal scale is used as explanatory variable.Disadvantages:
a) Nominal scale has no metric properties therefore many parametric statistics requiring continuous distribution can not be determined through nominal scale.
b) It requires different statistical conversation techniques to make it continuous.4.3.2
Ordinal Scale
Nominal scale can not order the events. It can label the event but can not estimate successive occurrence of events. Ordinal Scale assigns numerals or rank value following principles of successive categories. These principles make discrimination among the set of objects in terms of preference. A set of students can be ordered in terms of academic performance. A set of sportsmen can be ordered in terms of sports performance. Order can be made in the form of ascending like first, second, third or descending order like third, second and first. When two students get same marks, their orders will be same. It is called paired order or tied. Tied orders are averaged and next order occurs after the last order. For example, 3 events possess equal ranks say 3. Then each event will get 3, 4, 5 ranks and the average will be 4. Next event will start from 6. Ordinal scale does not assume equal distance between orders. Distance between 1st and 2nd is not equal to distance between 3rd and 4th. This is the disadvantage of the ordinal scale. Advantage of the ordinal scale is it's flexibility. One can follow both ascending and descending orders.
Instruction: Instruction of ordinal scale includes how to arrange the events in ascending or descending order.
Item stem : Item stem includes the issue or event and it's operational definition.Statistics : When data are arranged in order, frequency, percentage statistics are used like nominal scale. One can estimate which event has received first or second rank by analysis of frequency. One can use median when data are arranged with rank values. Most of the non-parametric statistics follow ordinal scale or ranks. Rank order correlation is widely used statistics when one is interested to determine coefficient of correlation in small sample distribution.
Advantages:
a) Ordinal scale is useful to arrange the objects in ascending or descending order.
b) Median value can be estimated through ordinal scale.
c) Relative preference of the object can be determined with ordinal scale.
d) Several non-parametric statistics use ordinal scale.Disadvantages
a) Like, nominal scale, it has limited use in statistics as it does not follow equidistant.
b) It can not be scored.
Interval Scale
In ordinal scale one can not make any subtraction or addition to classify the person, object or event. For example, second rank student can not be subtracted from first rank student to find out difference in performance between two ranked persons. Another problem in rank order scale, equidistance assumption can not be made. We can not assume rank difference between 1 and 2 is equal to same between 2 and 3. But interval scale assumes equidistant points between each of the scale elements. The widely used summated rating scale or Likert type rating scale is interval scale. It has properties of metric scale in terms of the extent of differences in response. It is assumed that response difference is equidistant. Some researchers call it as quassi continuous scale as middle response category appears to be neutral. Some researchers argue that this is categorical scale as they merely consider the numerical values. Therefore, we can interpret differences in the distance along the scale. We contrast this to an ordinal scale where we can only talk about differences in order, not differences in the degree of order. Any parametric statistics are useful to analyze the item data.
Instruction: Instruction of ordinal scale includes how to rank. But interval scale includes how to rate the response categories. Interval scale follows maximization principles. Response categories are more and equidistant. Numerals are assigned to different ratings. Widely used ratings are strongly agree, agree, undecided, disagree and strongly disagree.Item-stem :
It can be both affirmative and interrogative. To assess one's happiness, item stem may be how much happy are you ? Or I feel happy always. It must be remembered that response categories should not be in the item stem. In earlier example on 'I feel happy always', response categories should not include the text 'always' rather it can be strongly agree, agree, disagree, strongly disagree. Item stem and response categories will be framed in such a manner so that data distribution will not be skewed.Statistics: Interval scale follows equidistant principles, so any parametric statistics can be used.
Advantages:
a) Interval scale follows equidistant principles, so any parametric statistics can be used.
b) It can be scored.
c) it can be classified into groups by cut-off points.Disadvantages:
a) Interval scale has undecided point. This violates continuity.
b) It does not have neutral point like ratio scale.4.3.4.
Ratio scale:
Interval scale measures single dimension of variable across graded series. One's feeling of both happiness and unhappiness can be assessed by interval scale using two separate scales measuring happiness and unhappiness separately. Advantage of ratio scale is to assess both feeling of happiness and unhappiness simultaneously. For example, watching black cloud, farmers sometimes feel pleasant and sometimes feel unpleasant. Ratio scale is composed of two bi-polar adjectives. One adjective will be extremely opposite of another. For example, strong and weak, good and bad, active and lazy. This scale is often called as semantic differential scale as meaning of object or event is differentiated semantically with opposite adjectives. As per hypothesis, rating value is assigned to the adjective. Strong, good and active are assigned +3 and weak, bad and lazy are given -3 rating. So two opposite adjectives are located at two opposite poles of neutral point or 0. Other grades like -1,-2 are located between 0 and -3. Similarly, +1 and +2 are located between 0 and 3. So, final scale to assess strong and weak dimension will be +3, +2, +1, 0,-1,-2,-3. So, there are two interval scales ranging from +1 to +3 and from -1 to -3. Respondent assumes +3 as very strong, +2 as strong. Likewise, -3 as very weak, -2 as weak. And 0 is conceived as neutral.
Here zero stands for neither more nor less than none of the property represented by the scale.
Instruction: Instruction includes systematic rating from 0 to -3 or from 0 to +3. As there is no label from 0 to +3 or from 0 to -3, respondent can assign own label following direction of adjectives. For example, instead of very strong, respondent can think of very much strong.Item-stemScoring: Before scoring, researcher first assumes meaning of high score. For example, +3 is highest score and -3 is lowest. Then +3 will be replaced by 7 and -3 will be replaced by 1. 0 will be replaced by 4. So, highest score will be 7 and lowest score will be 1.
Statistics: Like interval scale, any parametric and non-parametric statistics can be used with ratio scale.Advantages:
a) Ratio scale can assess one object with bi-polar adjectives simultaneously.
b) Like normal probability curve, ratio scale assumes bi-polarity. It has zero like normal probability distribution. And the successive gradation from 0 to +3 or -3 is equidistant. Therefore, it can be used in any parametric statistics.
c) It is less time consuming for data collection.
d) It can assess different dimensions of one object simultaneously. Osgood has noted three opposite dimensions using ratio scale.Disadvantages:
a)Theoretically, one can not say that attributes of satisfaction are opposite of dissatisfaction. Herzberg has proved that attributes of job satisfaction is not opposite of the same for assessing job dissatisfaction. Therefore, use of bi-polar adjectives for assessing one event can not provide sufficient information.
b) It is complex to score as rating values during data collection are replaced by another value during scoring.
c) No event can be neutral, therefore considering 0 value as neutral is not meaningful.
Linear and Non-linear
In linear relationships, any given change in an independent variable will always produce a corresponding change in the dependent variable.Non-linear relationships are not linear, which means by doubling one variable, the other variable will not double. For example, the square is not linear. It is quadratic relations.
Normal Distribution
Homoscedasticity:
This assumption means that the variance around the regression line is the same for all values of the predictor variable (X). The plot shows a violation of this assumption. For the lower values on the X-axis, the points are all very near the regression line.
Student's t-distribution

The Student’s t-test
The Student’s t-test is a statistical test that can be used to test the null hypothesis that the difference between 2 means was caused by chance alone. By convention, if the p value is greater than 0.05 we conclude that the difference between the 2 means is NOT significant (i.e. there is a relatively high probability that it was caused by chance alone.) On the other hand, if the p value is less than 0.01 we conclude that the difference between the 2 mean is highly significant (i.e. there is a very low probability that it was caused by chance alone.) A p value between 0.01 and 0.05 is considered a borderline region, the difference is considered significant but not highly significant. In this case we would probably want to collect more data before we make a conclusion.
Research Studies
1.A Study on Self-reported Socio-Economic status by the Primary school children in rural areas: A problem of Social Survey -by Author
Ref: "A Study on Self-reported Socio-Economic status by the Primary school children in rural areas: A problem of Social Survey”. by Author
Stigler, S.M. (1986). The history of Statistics: The Measurement of uncertainty before 1900. Belknap Press, Cambridge, Mass.
Stigler, S.M. (1889). Francis Galton's account of the invention of correlation. Statistical science, 4, 2, 73-86.
Karl Pearson was influenced by Galton's work. After the death of Galton, he wrote Galton's work in his journal Biometrika. Both Galton and Pearson didn't consider correlation as causal relations. Like Galton, Pearson treated regression as causal relations.
https://projecteuclid.org/download/pdf_1/euclid.ss/1177012580
References
Galton, Francis. "Co-relations and their Measurement, chiefly from Anthropometric Data." Proceedings of the Royal Society of London, v45 (Nov 15 - April 11) 1888.
No comments:
Post a Comment